There are some questions that marketing teams frequently ask:
- What does our customer acquisition cost?
- What is the performance of our paid advertising?
- How much budget are we spending on ads and how many conversions do we get?
- Finding answers to these questions is essential, but answering them is difficult. Most marketing blog posts talk about its relevance, but few talk about how you can do it automatically.
One of the main challenges is that, to answer these questions, we must bring together several data sources.
In this guide, I’ll show you how to combine your Google Ads and Facebook Ads data to understand the overall performance of your digital ads.
You will understand how data combination and Google Data Studio work so that you can replicate them with each data source. We will also make some clarifications on the preparation of the data.
Connect Facebook Ads to Google Data Studio
If you haven’t used it yet, we have a Facebook Ads connector for Google Data Studio.
We also have a complete guide to reporting Facebook Ads with Google Data Studio. Google Data Studio has a free connector for Google Ads. You just need to go to the Google Data Studio connector gallery and connect from there.
Connect Google Ads to Google Data Studio
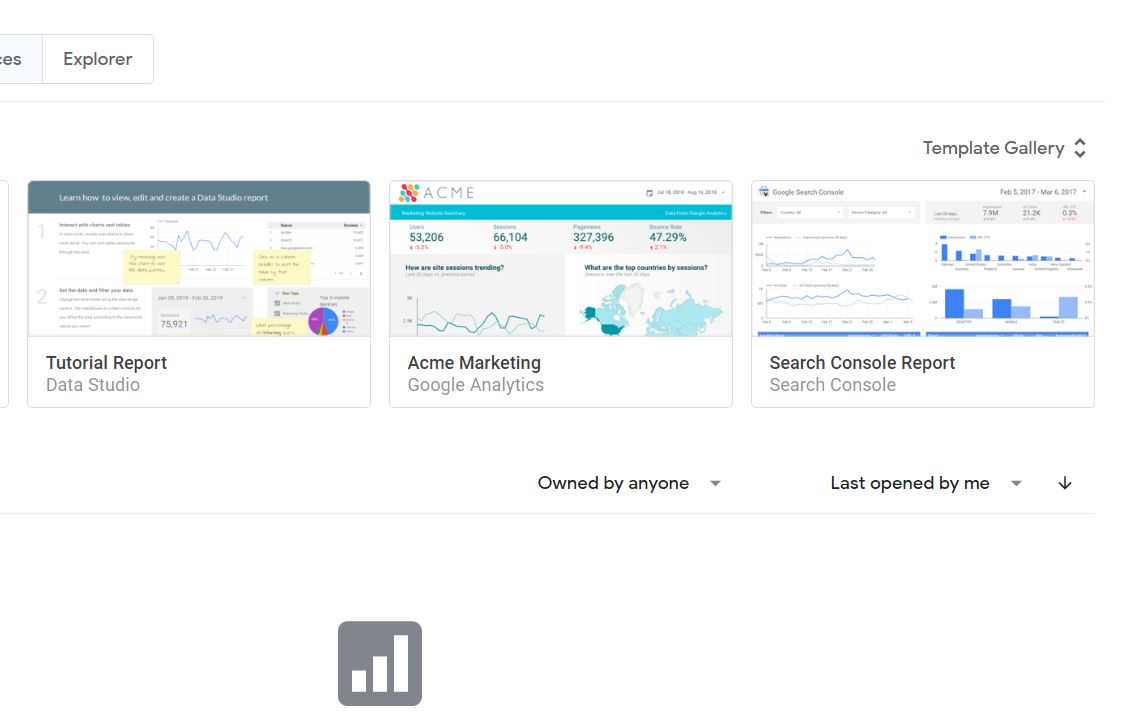
Set up the Google Data Studio report
The first step is to include the data sources from both Facebook Ads and Google Ads in a blank report.
In your new Google Data Studio report, simply go to ‘Resources’ and click ‘Manage added data sources.’

Close the data sources tab and let’s now create our first visualizations. I recommend that you always use tables to validate how your data looks and detect possible surprises.
Create a table for each data source where the dimension is Date and the metric is Amount Spent; in Google Ads it is ‘cost’ (cost) and in Facebook Ads it is ‘amount spent’ (amount spent).
We will add more metrics, such as conversions, once we test this connection.
In this case, we have spending data for each day for our Facebook Ads connector; We have only spent on Google Ads for 6 days during the chosen period.
By joining these tables, we want to combine the total spend for each day for each data source.
As such, most dates will remain the same as there is only spend from the Facebook Ads site.
But there are six days when we need to add the spending from both data sources.
For example, for July 1, your total ad spend would be $ 2,193.94 (21.82 + 2,172.12).
When we are joining two data sources, such as Facebook Ads and Google Ads, we need a common value to be able to make sure that this union makes sense.
These values or fields are keys to combine. Often times these join keys are IDs and dates.
We will tell Google Data Studio that our join is the date- If a value such as May 5, 2020 is in both data sources, the metrics that have data on that date in both data sources are subject to being combined.
Once we have a joins key, we can add the metrics and dimensions. We can customize this union type at any time.
In this case, we will only approach the respective spending metrics from both sources.

Alexander Hatala is an American entrepreneur and co-founder of Custom Design Partners, a digital strategy firm in Jacksonville, Florida. His core subjects are consumer behavior, digital analytics, customer retention, and conversion rate optimization. Alexander works within a wide variety of industries of all sizes and is often an independent consultant for digital operations and strategy for private and nonprofit organizations.